8.4 Hollow section column
8.4.1 Description
The component-based finite element method (CBFEM) for the hollow section column base verified to the component method (CM) is described below. A compressed column is designed as at least class 3 cross-section. The sensitivity study is prepared for the size of the column, the dimension of the base plate, concrete grade, and the dimension of the concrete block. Four components are activated: the column flange and web in compression, the concrete in compression including grout, the anchor bolt in tension and welds. This study is mainly focused on two components: concrete in compression including grout and anchor bolt in tension.
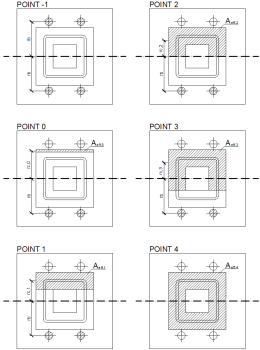
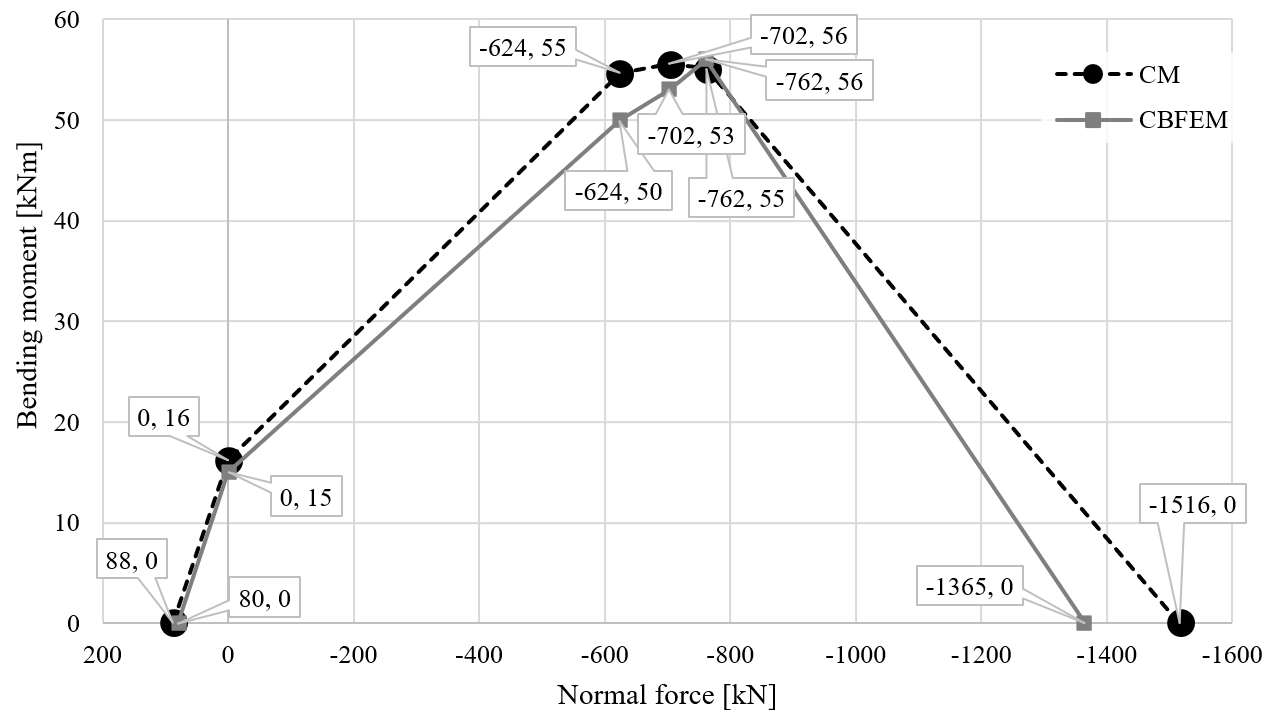
Fig. 8.4.1 Significant points of multilinear interaction diagram of square hollow section
8.4.2 Verification of resistance
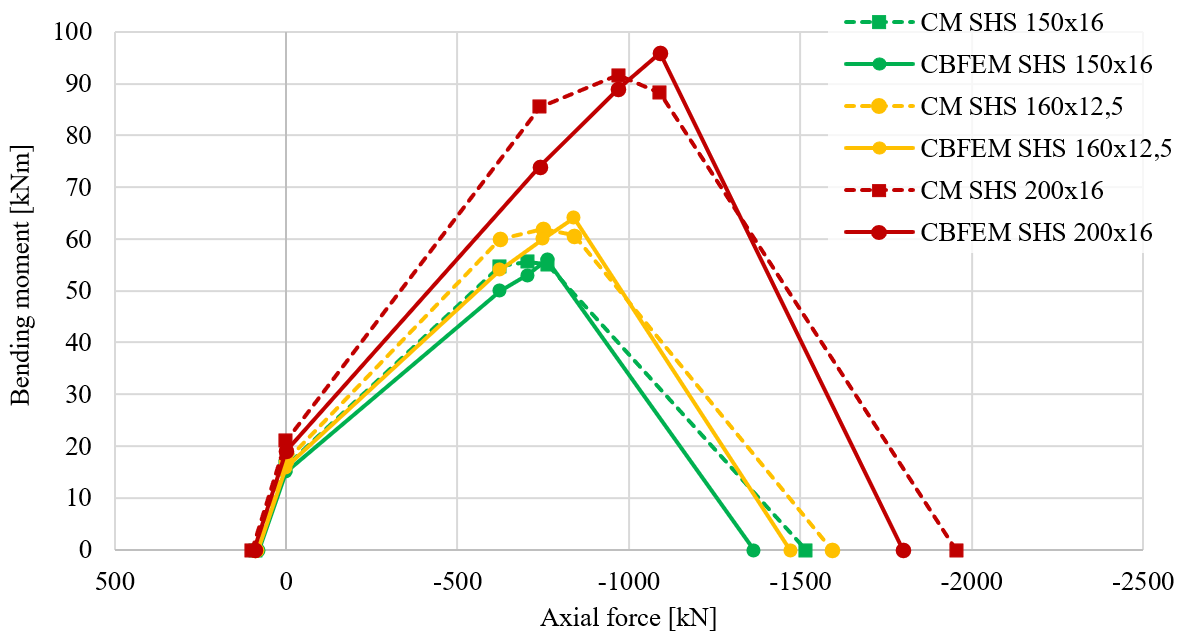
In following example, the column from square hollow section SHS 150×16 is connected to concrete block with the area dimensions \( a' = 750 \, \texttt{mm} \), \( b' = 750 \, \texttt{mm} \), and height \( h = 800 \, \texttt{mm} \) from concrete grade C20/25 by the base plate with dimensions \( a = 350 \, \texttt{mm} \), \( b = 350 \, \texttt{mm} \), \( t = 20 \, \texttt{mm} \) from steel S420. Anchor bolts are designed 4 × M20, As = 245 mm2 with a head diameter a = 60 mm from steel 8.8 with offsets at top 50 mm and left -20 mm. Grout has the thickness of 30 mm.
The results of the analytical solution are presented as an interaction diagram with distinctive points. A detailed description of points −1, 0, 1, 2, and 3 is shown in Fig. 8.4.1, see (Wald, 1995) and (Wald et al., 2008), where point −1 represents pure tensile force, point 0 pure bending moment, points 1 to 3 combined compressive force and bending moment, and point 4 pure compressive force.
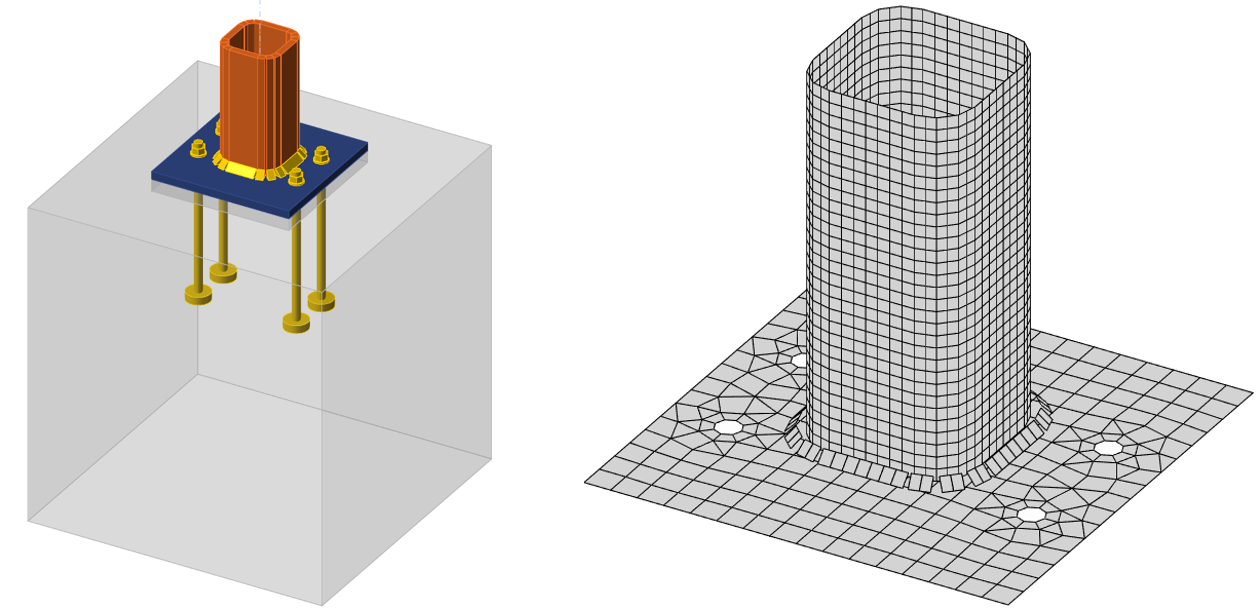
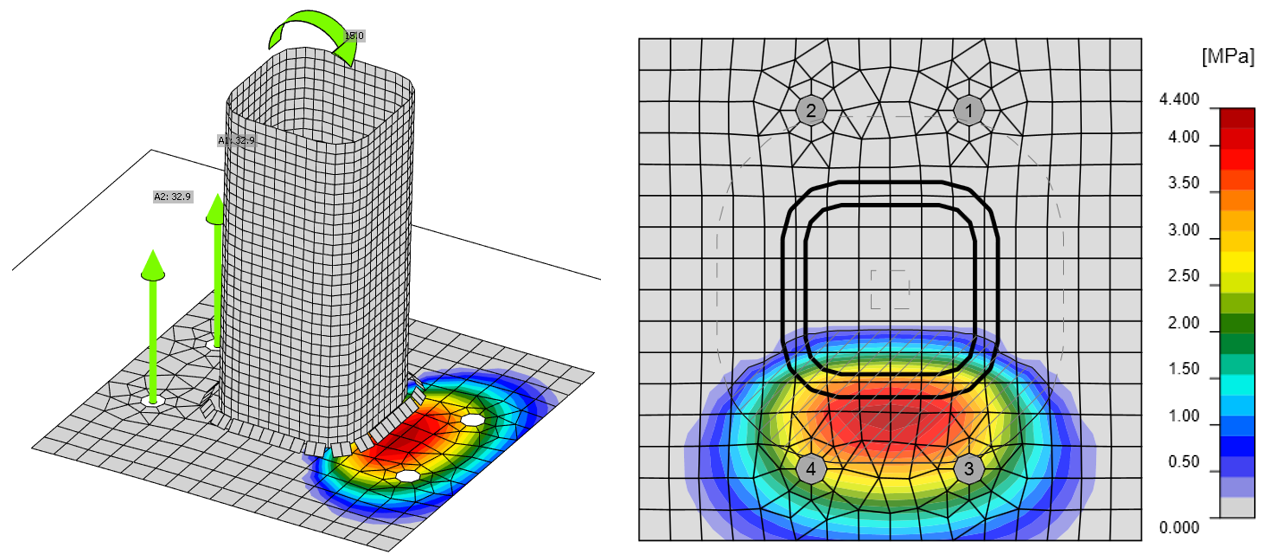
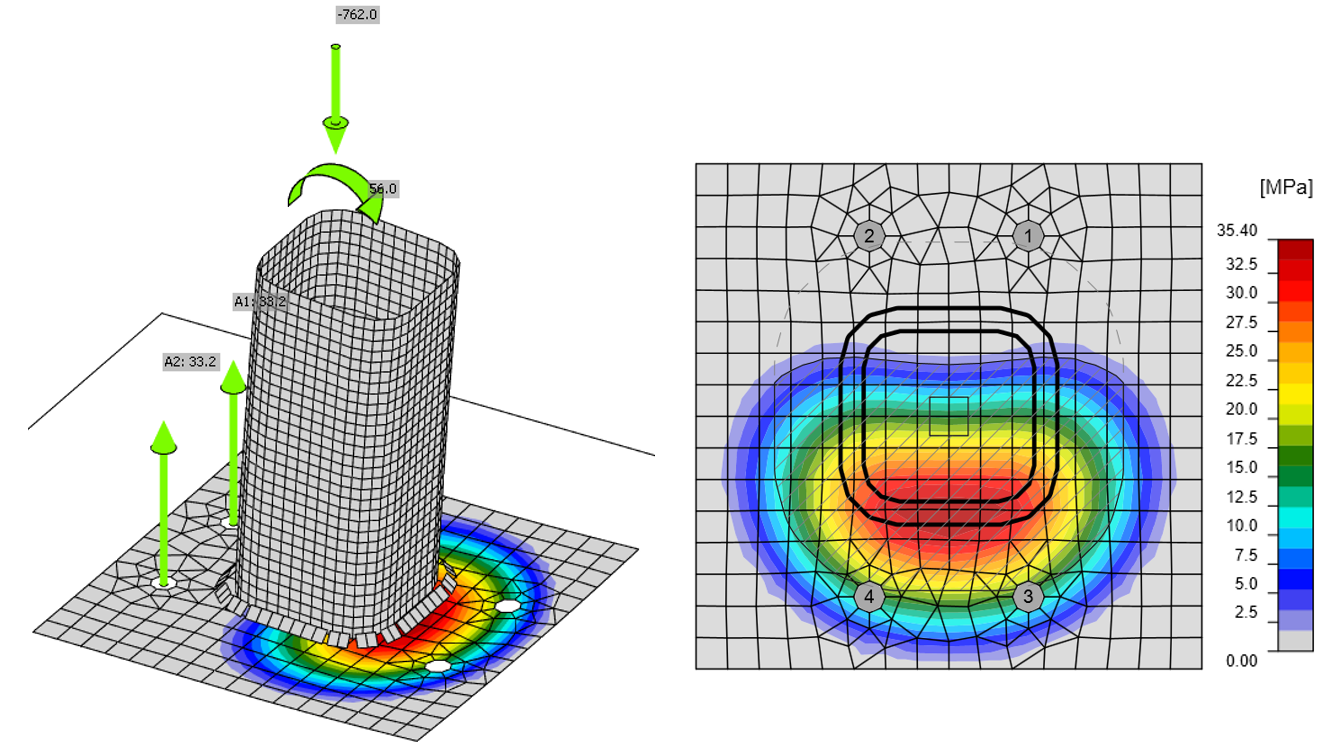
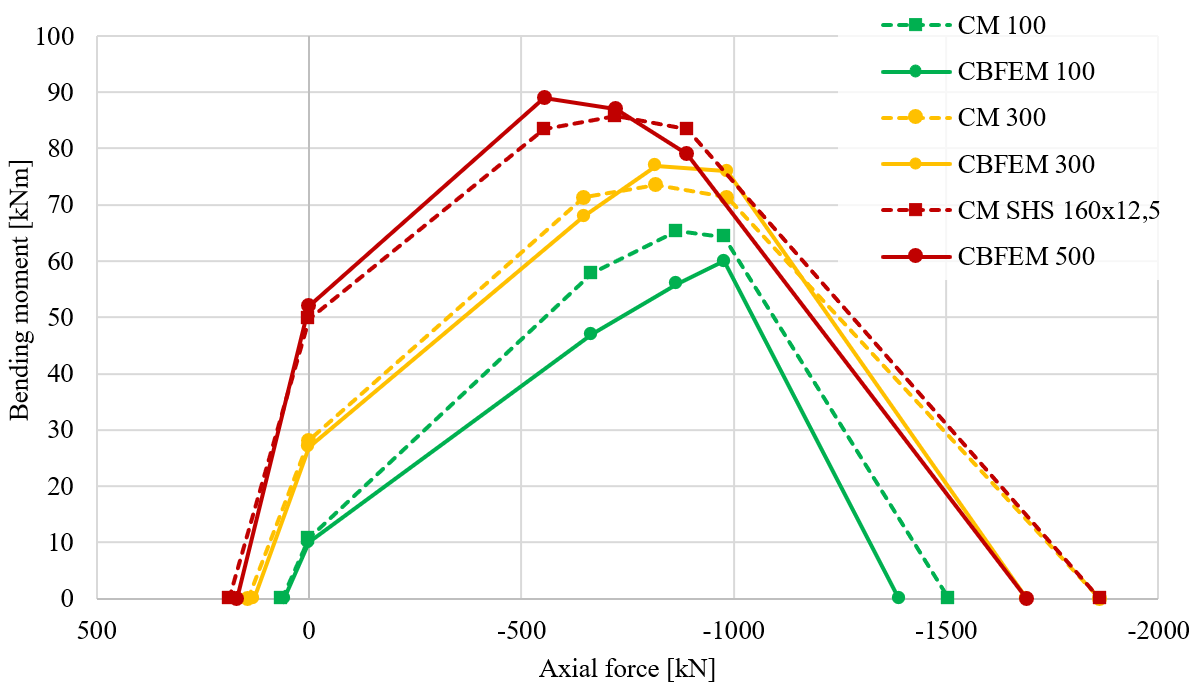
In CBFEM, the prying forces occur in case of loading in pure tension loading; while in CM, no prying forces are developed by limiting the resistance to 1-2 failure mode only, see (Wald et al., 2008). Due to the prying forces, the difference in resistance is about 10 %. The numerical model of the column base is shown in Fig. 8.4.2. Results by CBFEM are presented by the bearing stress distribution on concrete for points 0 and 3, displayed in Fig. 8.4.3 and Fig. 8.4.4 and compared on the interaction diagram in Fig. 8.4.5.