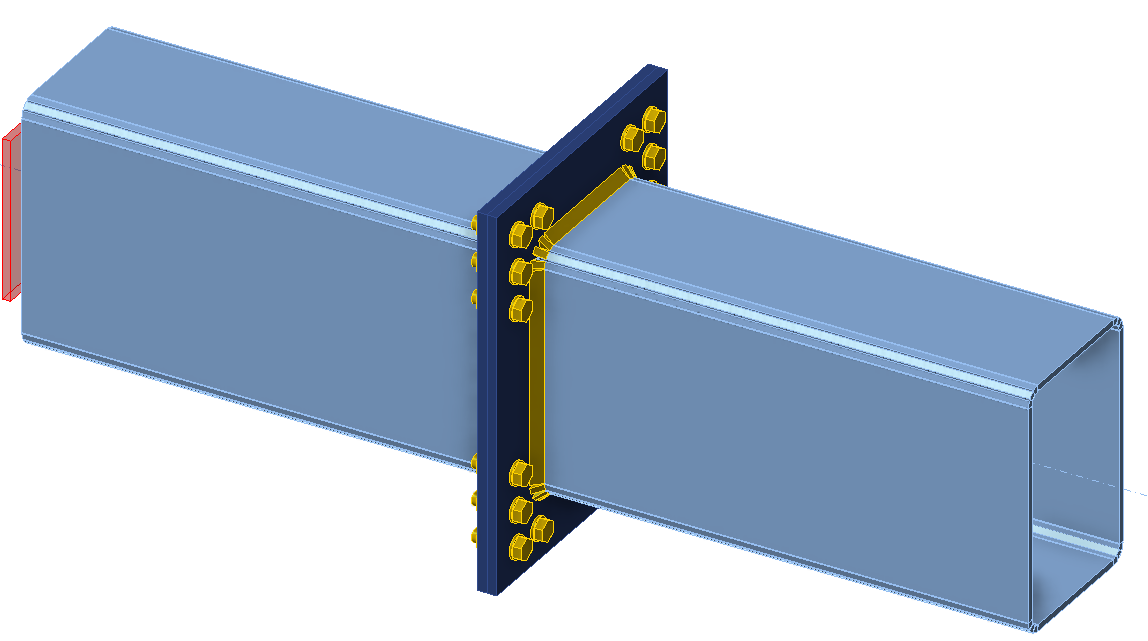
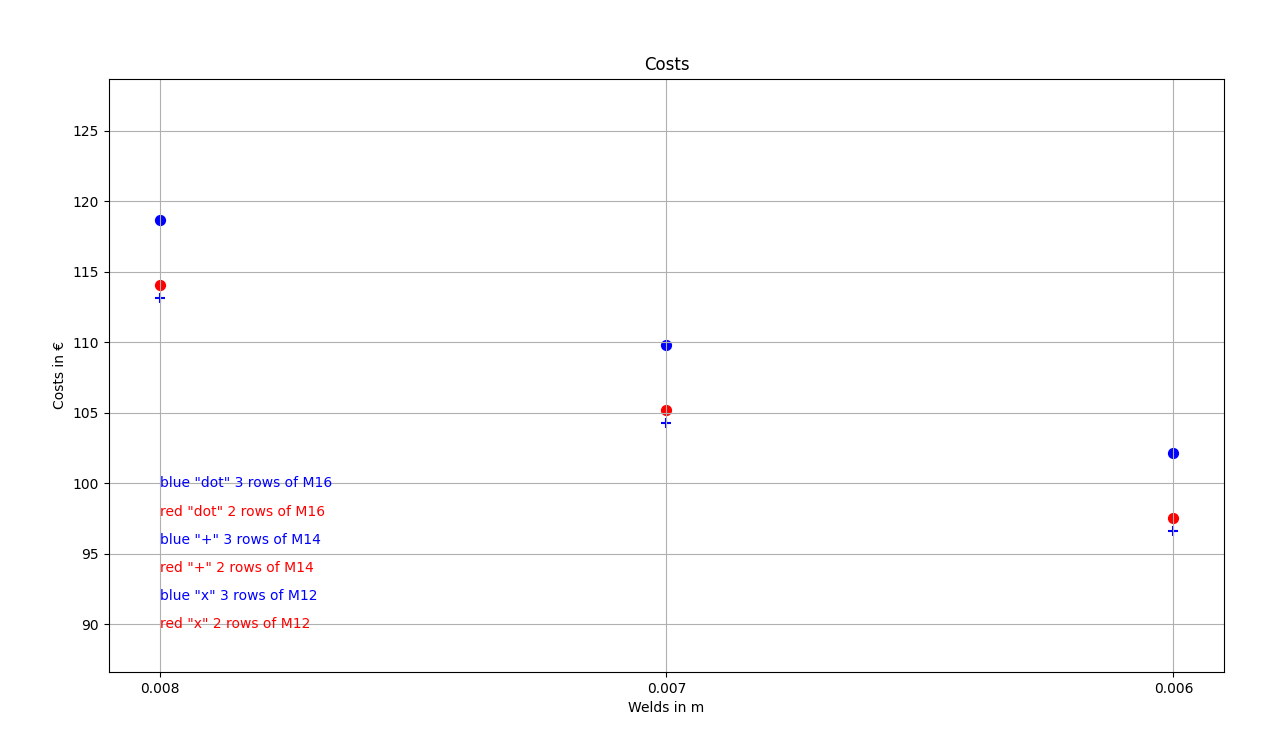
We want to optimize the connection's components (welds, diameter, and number of bolts). The result of the optimization is the joint's costs, which are neatly presented in a graph.
Python client
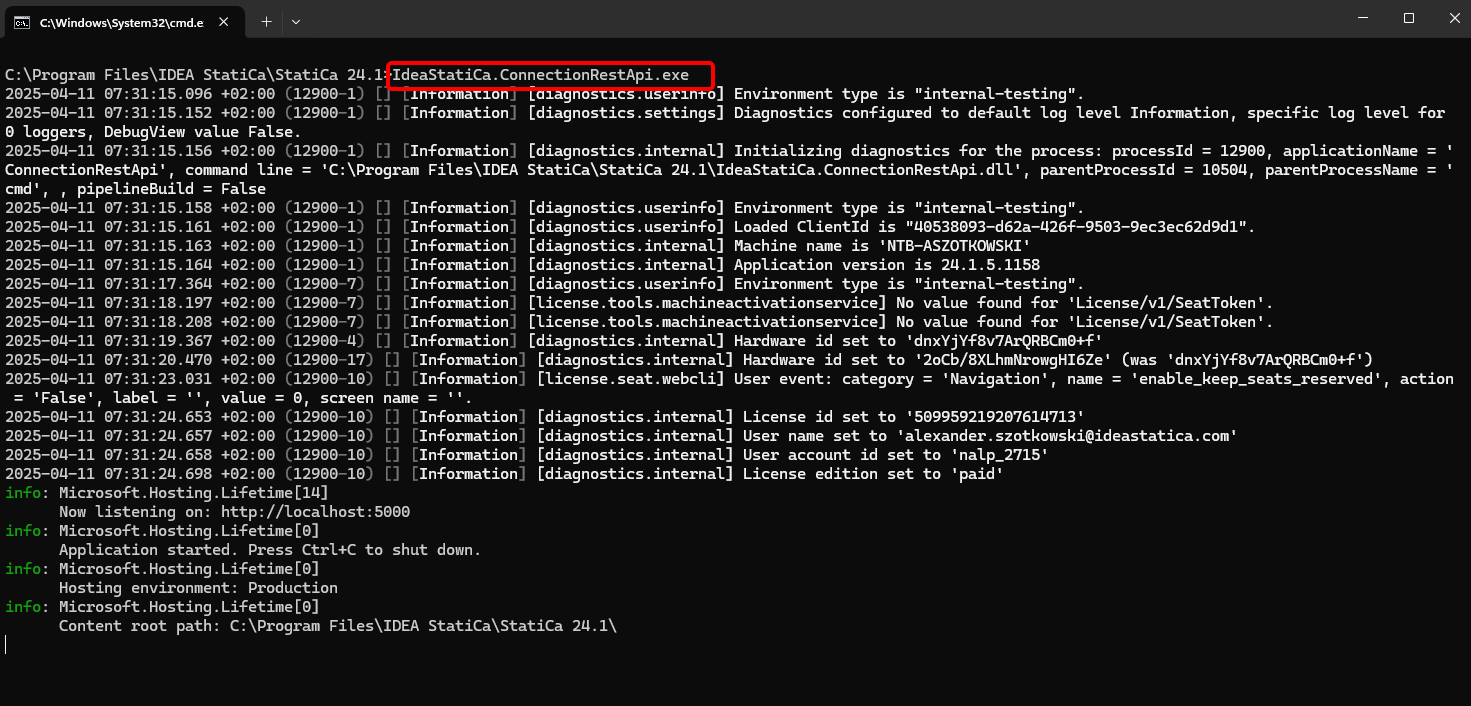
Run the "IdeaStatiCa.ConnectionRestApi.exe" in CMD within the proper IDEA StatiCa folder and open the IDE tool of your choice.
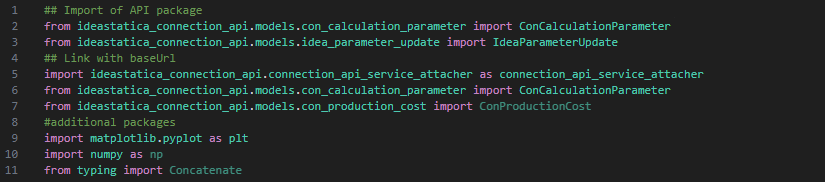
Create a new file and import the packages that will enable the use of calculation and link with the localhost URL.
## Import of API package from ideastatica_connection_api.models.con_calculation_parameter import ConCalculationParameter from ideastatica_connection_api.models.idea_parameter_update import IdeaParameterUpdate
## Link with baseUrl import ideastatica_connection_api.connection_api_service_attacher as connection_api_service_attacher from ideastatica_connection_api.models.con_calculation_parameter import ConCalculationParameterfrom ideastatica_connection_api.models.con_production_cost import ConProductionCost
#additional packages import matplotlib.pyplot as plt import numpy as np from typing import Concatenate
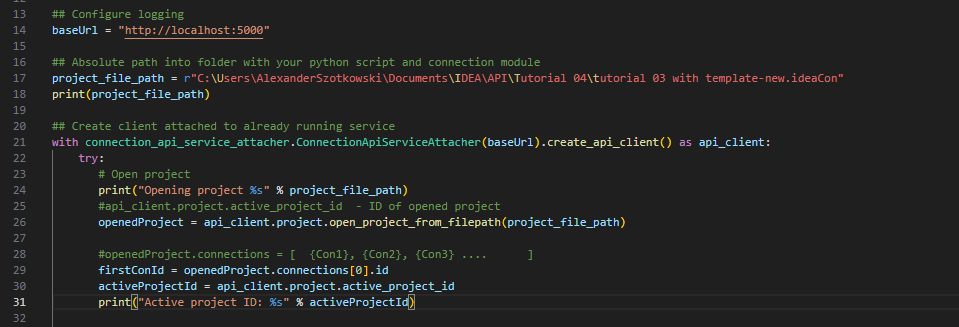
Configure the logging via the variable "baseUrl," which will pull up your localhost. In the second step, pair the absolute path of your IDEA StatiCa Connection file.
## Absolute path into folder with your python script and connection module project_file_path = r"C:\Users\AlexanderSzotkowski\Documents\IDEA\API\Tutorial 04\tutorial 03 with template -new.ideaCon" print(project_file_path)
Pair the client with an already running service. Use the block try/except - since the try block raises an error, the except block will be executed. In the first phase, it is necessary to open up the project and find the project ID of your project, which is unique for every IDEA StatiCa project. Then we select the first connection stored in our file.
# Create a client attached to an already running service with connection_api_service_attacher.ConnectionApiServiceAttacher(baseUrl).create_api_client() as api_client: try: # Open project print("Opening project %s" % project_file_path) #api_client.project.active_project_id - ID of opened project openedProject = api_client.project.open_project_from_filepath(project_file_path)
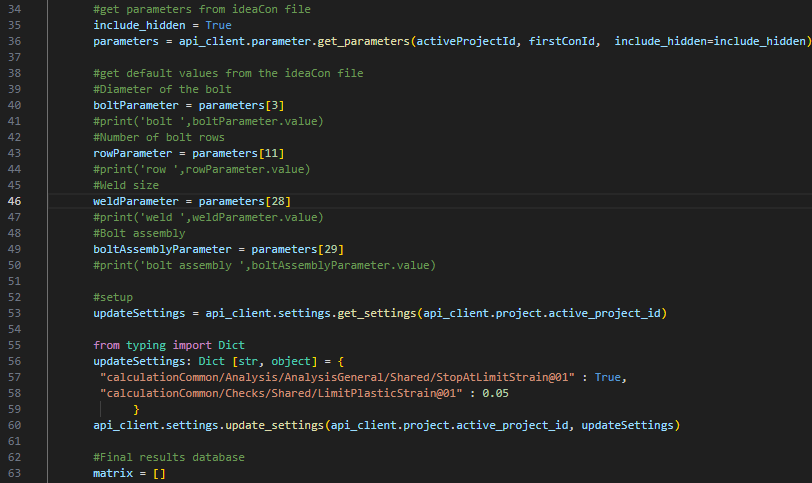
Retrieve all needed parameters from the ideaCon (number of bolts, diameter, weld size, bolt assembly)
#get parameters from ideaCon file include_hidden = True parameters = api_client.parameter.get_parameters(activeProjectId, firstConId, include_hidden=include_hidden) #get default values from the ideaCon file #Diameter of the bolt boltParameter = parameters[3] #print('bolt ',boltParameter.value) #Number of bolt rows rowParameter = parameters[11] #print('row ',rowParameter.value) #Weld size weldParameter = parameters[28] #print('weld ',weldParameter.value) #Bolt assembly boltAssemblyParameter = parameters[29] #print('bolt assembly ',boltAssemblyParameter.value)
We want to get results only when the calculation is 100% positive for all parts (plates, welds, bolts), so we have to set the Stop at the limit strain on True. Results will be stored in a list, called matrix, which we then use to display a graph.
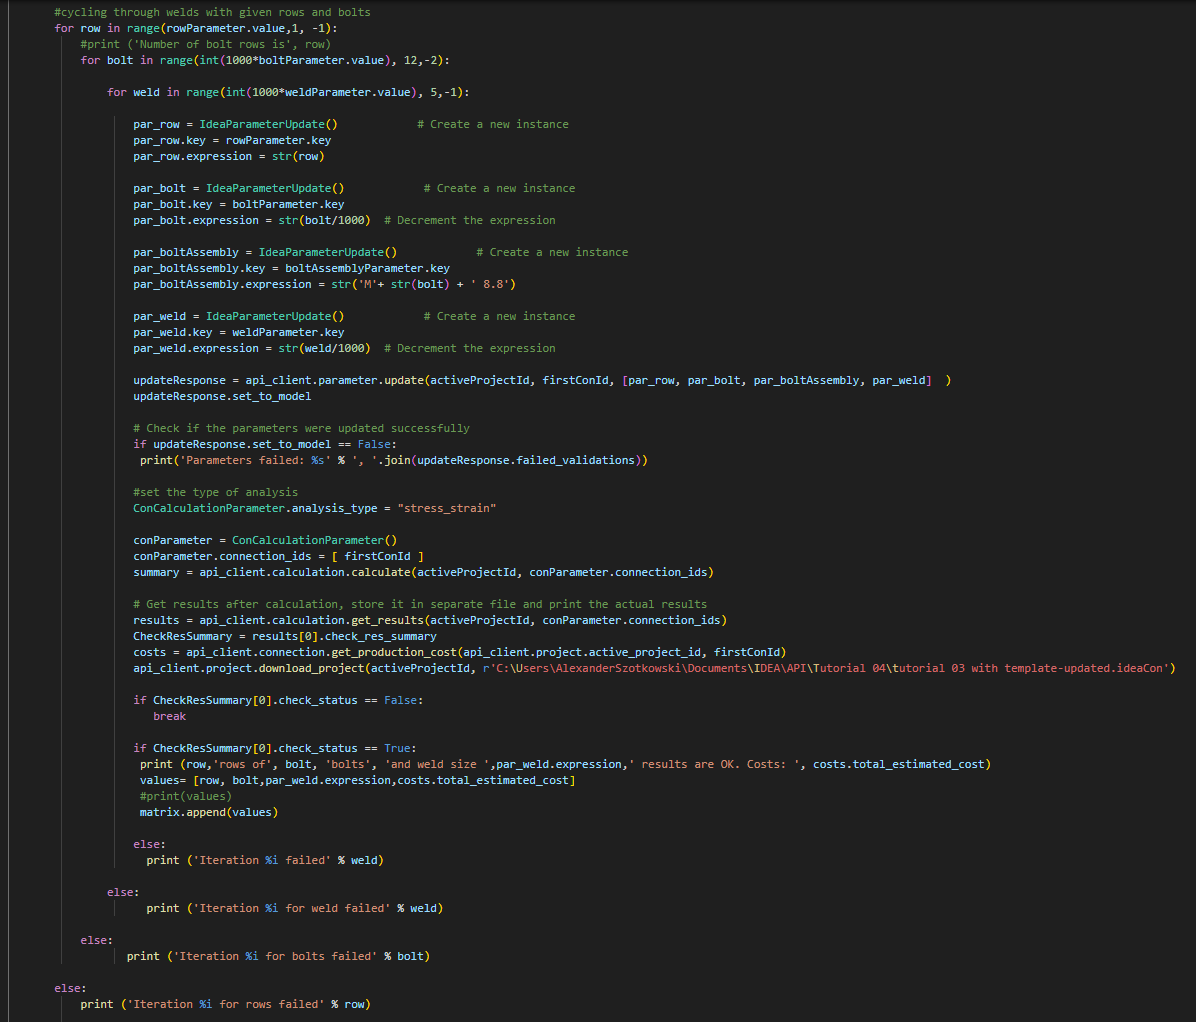
Now, we start a cycle by changing the welds (from t = 8 to 5 mm), bolt diameter (from M16 to M12), and number of rows (from 3 to 1). The numbers 8, M16, and 3 are values taken from the ideaCon file. The ongoing results are printed on the screen and also added to the list of results.
#cycling through welds with given rows and bolts for row in range(rowParameter.value,1, -1): #print ('Number of bolt rows is', row) for bolt in range(int(1000*boltParameter.value), 12,-2):
for weld in range(int(1000*weldParameter.value), 5,-1):
par_row = IdeaParameterUpdate() # Create a new instance par_row.key = rowParameter.key par_row.expression = str(row)
par_bolt = IdeaParameterUpdate() # Create a new instance par_bolt.key = boltParameter.key par_bolt.expression = str(bolt/1000) # Decrement the expression
par_boltAssembly = IdeaParameterUpdate() # Create a new instance par_boltAssembly.key = boltAssemblyParameter.key par_boltAssembly.expression = str('M'+ str(bolt) + ' 8.8')
par_weld = IdeaParameterUpdate() # Create a new instance par_weld.key = weldParameter.key par_weld.expression = str(weld/1000) # Decrement the expression
# Check if the parameters were updated successfully if updateResponse.set_to_model == False: print('Parameters failed: %s' % ', '.join(updateResponse.failed_validations))
#set the type of analysis ConCalculationParameter.analysis_type = "stress_strain"
# Get results after calculation, store it in separate file and print the actual results results = api_client.calculation.get_results(activeProjectId, conParameter.connection_ids) CheckResSummary = results[0].check_res_summary costs = api_client.connection.get_production_cost(api_client.project.active_project_id, firstConId)
api_client.project.download_project(activeProjectId, r'C:\Users\AlexanderSzotkowski\Documents\IDEA\API\Tutorial 04\tutorial 03 with template-updated.ideaCon')
if CheckResSummary[0].check_status == False: break
if CheckResSummary[0].check_status == True: print (row,'rows of', bolt, 'bolts', 'and weld size ',par_weld.expression,' results are OK. Costs: ', costs.total_estimated_cost) values= [row, bolt,par_weld.expression,costs.total_estimated_cost] #print(values) matrix.append(values)
else: print ('Iteration %i failed' % weld)
else: print ('Iteration %i for weld failed' % weld)
else: print ('Iteration %i for bolts failed' % bolt)
else: print ('Iteration %i for rows failed' % row)
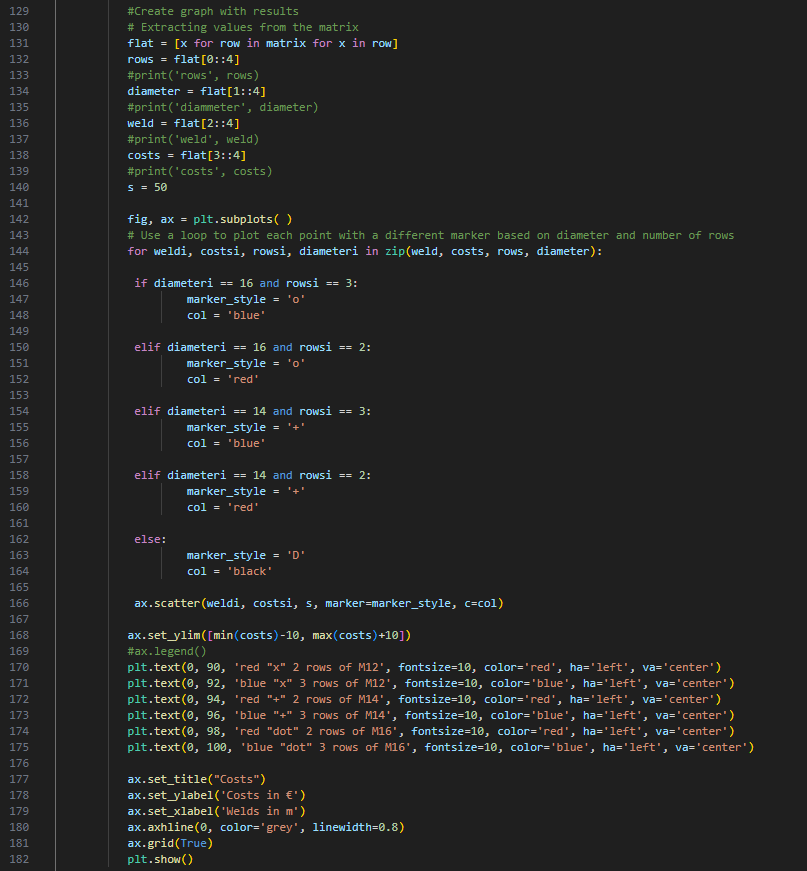
The last part is about creating a graph with our results.
#Create graph with results # Extracting values from the matrix flat = [x for row in matrix for x in row] rows = flat[0::4] #print('rows', rows) diameter = flat[1::4] #print('diammeter', diameter) weld = flat[2::4] #print('weld', weld) costs = flat[3::4] #print('costs', costs) s = 50
fig, ax = plt.subplots( ) # Use a loop to plot each point with a different marker based on diameter and number of rows for weldi, costsi, rowsi, diameteri in zip(weld, costs, rows, diameter):
if diameteri == 16 and rowsi == 3: marker_style = 'o' col = 'blue'
elif diameteri == 16 and rowsi == 2: marker_style = 'o' col = 'red'
elif diameteri == 14 and rowsi == 3: marker_style = '+' col = 'blue'
elif diameteri == 14 and rowsi == 2: marker_style = '+' col = 'red'